RViz Marker Publisher: Programming Guide
Robotics and Autonomous Systems Group, Research Engineering Facility, Research Infrastructure Queensland University of Technology
Links to Sections
Introduction
The aim of this document is to guide users on the use of RViz Marker Publisher package for implementing scene visualization of a ROS2 application.
The package supports three types of objects supported in the visualization framework of ROS2, including Marker, MarkerArray, and PointCloud2.
Prerequisites for Running the Example Programs
The examples used in this programming guide require a ROS2 (jazzy) environment (refer to package.xml), a workspace at ${ROS2_WS} and the rviz_marker_publisher package has been installed under ${ROS2_WS}/src/.
Execute the following commands to install ROS2 dependencies.
source /opt/ros/jazzy/setup.bash

cd ${ROS2_WS}
rosdep update && rosdep install -y -r -i --rosdistro jazzy --from-paths .
Execute the following commands to build the workspace and to update the environment variables so that ROS2 can find the example programs provided by this repository.
cd ${ROS2_WS}
colcon build --event-handlers console_direct+
source instll/setup.bash
[!NOTE] Do not know how to setup the ROS environment for running the example programs? Click below for the installation guide.
The First Example
The example program intro_0.py provides a basic example of using rviz_marker_publisher to publish a marker.
Running the Example
Launch RViz2 and configure the display to include
Marker,MarkerArray, andPointCloud2.
rviz2
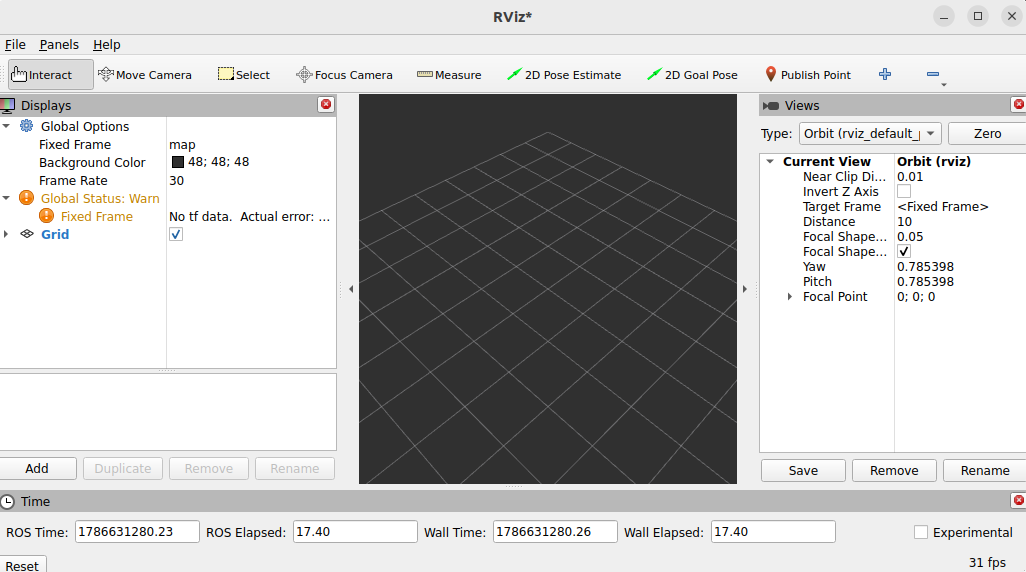
At the bottom of the Display panel, press the Add button. On the popup, select Marker from the list and press OK to confirm
A Marker placeholder is now added to the Display list.
Enter
/visualization_markerin the topic textbox under Marker. RViz2 will subscribe to the topic and receive markers published to the topic.
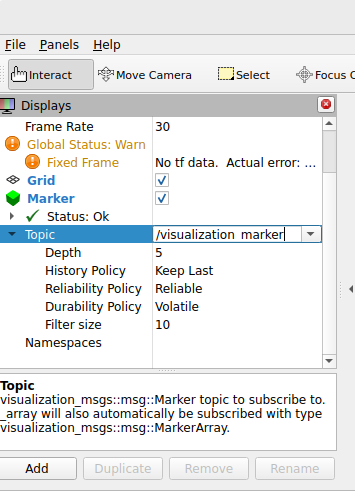
Repeat the above and add MarkerArray and PointCloud2 to the display. The topics for the two display types are given in the table below.
Display Type |
Topic |
|---|---|
Marker |
|
MarkerArray |
|
PointCloud2 |
|
These are the default topics defined by
rviz_marker_publisher.
Launch the example program
intro_0.py. The suffix.pyis omitted in the command.
ros2 run rviz_marker_publisher intro_0
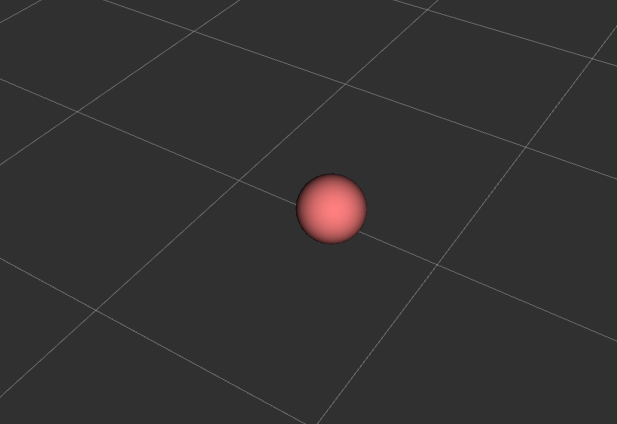
The program will clear the 3D scene and publish a red sphere at position (1, 1, 1).
Using the Package: Essential Setup
The file intro_0.py is listed below.
import time
import rclpy
from rclpy.node import Node
from visualization_msgs.msg import Marker
import rviz_marker_publisher
from rviz_marker_publisher import RvizMarkerPublisher, get_logger
logger = get_logger()

def main():
    # section 1: enable ROS2 node and create the RVizVisualizer
    rclpy.init()
    the_node:Node = Node(node_name='test_rv_node')
    rv = RvizMarkerPublisher(the_node)
    rviz_marker_publisher.spin_in_thread(the_node)
    # section 2: wait for the discovery and matching of publishers and subscribers
    logger.info('(wait) discovery and matching of publishers and subscribers')
    time.sleep(2.0)

    # section 3: create a sphere marker and publish it with the RVizVisualizer
    logger.info('(add) create_sphere_marker and wait for 5 seconds')
    sphere_marker:Marker = rviz_marker_publisher.create_sphere_marker(name='sphere', id=1, xyzrpy=[1, 1, 1], frame_id='map', scale=0.50, rgba=[1.0, 0.5, 0.5, 1.0])
    rv.publish(sphere_marker)

    # pause before terminate until Enter is press
    input('Press Enter to terminate')
    rclpy.shutdown()
The purpose of section 1 of the function main is to enable the program to participate in the ROS2 environment and to launch an instance of RvizMarkerPublisher. A RvizMarkerPublisher instance will execute as an active component interacting with other ROS2 computational nodes.
def main():
    rclpy.init()                                # initialize the ROS2 software and communication layer
    the_node = Node(node_name='test_rv_node')   # establish this process as part of the ROS2 environment
    # create the RVizVisualizer
    rv = RvizMarkerPublisher(the_node)              # create an instance of RvizMarkerPublisher, the parameter node enables RvizMarkerPublisher to publish markers to other ROS2 computation nodes such as rViz2
    rviz_marker_publisher.spin_in_thread(the_node)  # create a thread for RvizMarkerPublisher to actively manage and publish markers
The next section pause the process to allow time for the discovery and matching of publishers and subscribers, so that the RViz, as a subscriber, will receive markers when published by the example program.
    ...
    logger.info('(wait) discovery and matching of publishers and subscribers')
    time.sleep(2.0)
In section 3 one of the marker creation functions of rviz_marker_publisher is called to create a sphere marker. Then the publish function is called to request the RvizMarkerPublisher instance to publish the marker.
    ...
    sphere_marker:Marker = rviz_marker_publisher.create_sphere_marker(name='sphere', id=1, xyzrpy=[1, 1, 1], frame_id='map', scale=0.50, rgba=[1.0, 0.5, 0.5, 1.0])
    rv.publish(sphere_marker)
    ...
The function create_sphere_marker returns a populated Marker object based on the passed parameters.
Function parameters |
Definition |
Remarks |
|---|---|---|
|
A string indicating the namespace of the marker |
Many visualization tools organize markers of the same namespace into a group for control functions |
|
An integer for identification |
The |
|
The position of the sphere in the frame of reference |
A 3-tuple (x, y, z) of |
|
The frame of reference |
default to be the fixed frame of the scene |
|
The size of the sphere |
a single number or a 3-tuple (lx, ly, lz) indicating the 3-dimensional size |
|
The color |
either a 3-tuple (r, g, b) or 4-tuple (r, g, b, a) of |
|
The marker will remain visible for this number of seconds |
default is 0 meaning it will persist indefinitely |
The
nameandiduniquely identify a marker object published to a topic. A new marker will replace an old marker if the composite tuple ofnameandidis the same.A marker with a
lifetimeof 0 will persist indefintely until the termination of RViz2 or the marker is de-selected in RViz2 (either as a namespace or as a topic). A marker with a positivelifetimeshould be automatically removed by RViz2 (or other visualization tools).
Persistence of Markers
Generally, the RvizMarkerPublisher supports three modes of marker persistence.
Publish Once and Forget
The publish-once-and-forget is the default mode.
To receive the marker, the visualization tool must be launched and subscribing to the relevant topic.
The received marker will be displayed for a period according to the
lifetimeparameter.A late-joining visualization tool will never receive the marker.
The mode is enabled by the function publish.
# function prototype
def publish(self, the_object:Marker | MarkerArray | PointCloud2, topic:str=None, delay:float=None, update_stamp:bool=True) -> Marker | MarkerArray | PointCloud2
Parameters |
Definitions |
Remarks |
|---|---|---|
|
The object to be published |
Any of the |
|
The target ROS2 topic |
|
|
The waiting time in seconds before the object is published |
default to no delay |
|
The timestamp of the object is updated at publishing |
default to |
The function returns the value of the parameter the_object, allowing the object to be created inline and returned in the function call.
Publish and Cache for Refresh Visualization Tools
The publish-and-cache mode is enabled by the function publish_and_cache. Refer to the example intro_1.py that has replaced the publish call in intro_0.py by publish_and_cache.
    # intro_1.py
    ...
    # section 3: create a sphere marker, publish and cache it with the RVizVisualizer
    logger.info('(add) create_sphere_marker and call publish_and_cache')
    sphere_marker:Marker = rviz_marker_publisher.create_sphere_marker(name='sphere', id=1, xyz=[1, 1, 1], frame_id='map', scale=0.50, rgba=[1.0, 0.5, 0.5, 1.0])
    rv.publish_and_cache(sphere_marker)
The cached marker is re-published indefintely until the node terminates.
A late-joining visualization tool will receive the marker in a future re-publish.
The persistence of each received marker is determined by the
lifetimeparameter.The default re-publish cycle (in seconds) may be configured at the instantiation of
RvizMarkerPublisher. See the example below.
    # change the re-publish cycle to 1.0 s
    rv = RvizMarkerPublisher(the_node, republish_timer_cycle=1.0)
The function publish_and_cache supports a different set of parameters.
# function prototype
def publish_and_cache(self, the_object:Marker | MarkerArray | PointCloud2, topic:str=None, pub_tf:bool=False, update_stamp:bool=True) -> Marker | MarkerArray | PointCloud2
Parameters |
Definitions |
Remarks |
|---|---|---|
|
The object to be published |
Any of the |
|
The target ROS2 topic |
|
|
Turn the marker into a reference frame if it is |
default to |
|
The timestamp of the object is updated at publishing |
default to |
Read the section on Marker-linked Transform on the purpose of the parametere pub_tf.
Publish to a Topic with QoS TRANSIENT_LOCAL Durability
The publish-to-transient-local-topic mode is enabled by activating a new topic configured with the TRANSIENT_LOCAL durability QoSProfile. Refer to section 2 of the example intro_2.py.
    # intro_2.py
    ...
    # section 2: activate a new topic for publishing Marker based on a Qos durability of TRANSIENT_LOCAL
    qos_profile = QoSProfile(durability=QoSDurabilityPolicy.TRANSIENT_LOCAL, reliability=QoSReliabilityPolicy.RELIABLE, history=QoSHistoryPolicy.KEEP_LAST, depth=50)
    PERSISTENT_TOPIC_NAME = '/visualization_marker_persistent'
    logger.info(f'(create topic) {PERSISTENT_TOPIC_NAME} with durability TRANSIENT_LOCAL')
    rv.activate_topic(PERSISTENT_TOPIC_NAME, Marker, qos_profile=qos_profile)
Use the
publishfunction and specify the new topic/visualization_marker_persistentas the target.
    # intro_2.py
    ...
    # section 4: create a sphere marker, publish and cache it with the RVizVisualizer
    rv.publish(sphere_marker, topic=PERSISTENT_TOPIC_NAME)
The published marker will persist or latched until the node terminates.
A late-joining visualization tool will receive the marker when it has subscribed the topic.
The persistence of the received marker is still determined by the
lifetimeparameter.
[!NOTE] Try the example programs
intro_1andintro_2to compare the effect of the three modes on whether RViz2 will receive the marker.ros2 run rviz_marker_publisher intro_1ros2 run rviz_marker_publisher intro_2
The Default Topics
The three default topics activated by RvizMarkerPublisher are listed in the table below.
Topic |
Message Type |
Default QoS Profile |
|---|---|---|
|
|
|
|
|
|
|
|
|
The three topics share the same
QoSProfile.
QoSProfile(
    durability=QoSDurabilityPolicy.VOLATILE,
    reliability=QoSReliabilityPolicy.RELIABLE,
    history=QoSHistoryPolicy.KEEP_LAST,
    queue=50)
A different
QoSProfilecan be specified at the instantiation ofRvizMarkerPublisher. Note that thisQoSProfilewill be adopted by all the default topics.
    ...
    qos_profile = QoSProfile(durability=QoSDurabilityPolicy.TRANSIENT_LOCAL, reliability=QoSReliabilityPolicy.RELIABLE, history=QoSHistoryPolicy.KEEP_LAST, depth=50)
    rv = RvizMarkerPublisher(the_node, default_qos_profile=qos_profile)
Creating Marker, MarkerArray, and PointCloud2 Messages
A set of functions is provided by the package rviz_marker_publisher to simplify building the Marker, MarkerArray and PointCloud2 messages.
Building Markers
The following table summarizes the functions for building different types of Marker.
Type |
Function |
Remarks |
|---|---|---|
Sphere |
|
Display a triaxial ellipsoid if the scale of the three axes are different |
Cylinder |
|
|
Cube |
|
Display a 3D box defined by the min xyz and max xyz |
Cube |
|
Display a 3D box of the given dimension defined by both the position (xyz) and orientation (rpy) |
Text |
|
|
Line |
|
Display a line defined by the two end-points (xyz) |
Arrow |
|
Display a arrow defined by the position (xyz) and orientation (rpy), and the thickness defined by the scale |
Path |
|
Display a path defined by lines connected by points in a list |
Mesh |
|
Display a 3D mesh file at the given URI |
AxisPlane |
|
Display a plane of a given length and width that aligns with one of the three axis planes (xy, xz, or yz) |
Markers can be configured by passing parameters. The following lists the parameters common to all the functions.
Common function parameters |
Definitions |
Remarks |
|---|---|---|
|
A string indicating the namespace of the marker |
Many visualization tools organize markers of the same namespace into a group for control functions |
|
An integer for identification |
The |
|
The frame of reference |
default to the fixed frame of the scene specified in |
|
The size of the sphere |
a single number or a 3-tuple (lx, ly, lz) indicating the 3-dimensional size |
|
The color |
either a 3-tuple (r, g, b) or 4-tuple (r, g, b, a) of |
|
The marker will remain visible for this number of seconds |
default is 0 meaning it will persist indefinitely |
Each of the functions and the parameters specific to the functions are discussed below.
Sphere: create_sphere_marker
# the function prototype
def create_sphere_marker(name:str, id:int, xyzrpy:list, frame_id:str=None, scale=0.2, rgba:list=None, lifetime:float=None) -> Marker
Function parameters |
Definitions |
Acceptable Values |
|---|---|---|
|
The position and optionally the orientation of the sphere |
A 3-tuple (x, y, z) with (r, p, y) default to (0, 0, 0) |
A 6-tuple (x, y, z, r, p, y) |
||
A |
||
A |
The following example shows how to create a blue sphere of size 1.0 with zero transparency at the xyz location (0.5, 1.0, 0.0). The orientation is irrelevant for a sphere.
rviz_marker_publisher.create_sphere_marker(name='group_1', id=0, xyzrpy=[0.5, 1.0, 0.0], scale=1.0, rgba=[0.0, 0.0, 1.0, 0.0], lifetime=None)
To create a triaxial ellipsoid, pass a 3-list to the parameter scale and optionally pass the orientation of the ellipsoid.
rviz_marker_publisher.create_sphere_marker(name='group_1', id=0, xyzrpy=[0.5, 1.0, 0.0, 3.14, 0, 0], scale=[1.0, 0.5, 0.2], rgba=[0.0, 0.0, 1.0, 0.0], lifetime=None)
Use the lifetime parameter to display the marker for a specific duration, for example, 2 seconds.
rviz_marker_publisher.create_sphere_marker(name='group_1', id=0, xyzrpy=[0.5, 1.0, 0.0], scale=1.0, rgba=[0.0, 0.0, 1.0, 0.0], lifetime=2.0)
Run the example scripts sphere_marker.py, sphere_marker_lifetime.py, and sphere_marker_multi.py for a demonstration.
Cylinder: create_cylinder_marker
# the function prototype
def create_cylinder_marker(name:str, id:int, xyzrpy:list, frame_id:str=None, scale=[0.1, 0.1, 0.2], rgba:list=None, lifetime:float=None) -> Marker
Function parameters |
Definitions |
Acceptable Values |
|---|---|---|
|
The position and optionally the orientation of the cylinder |
A 3-tuple (x, y, z) with (r, p, y) default to (0, 0, 0) |
A 6-tuple (x, y, z, r, p, y) |
||
A |
||
A |
The following example shows how to create a green cylinder of base size (0.5 x 0.5) and a height of 1.0 with 50% transparency at the xyz location (0.0, 0.5, 0.5) and orientation (0, 0, 0).
rviz_marker_publisher.create_cylinder_marker(name='path', id=1, xyzrpy=[0, 0.5, 0.5, 0, 0, 0], frame_id='map', scale=[0.5, 0.5, 1.5], rgba=[0.0, 1.0, 0.5, 0.5])
Run the example script cylinder_marker.py for a demonstration.
Cuboid: create_cube_marker_from_bbox and create_cube_marker_from_xyzrpy
The package provides two ways to specify the geometry of a cube marker, the first way is to specify the minimum and maximum (x, y, z) values. The size is implicitly defined by the two positions.
# the function prototype
def create_cube_marker_from_bbox(name:str, id:int, bbox3d:list, frame_id:str=None, rgba:list=None, lifetime:float=None) -> Marker
Function parameters |
Definitions |
Acceptable Values |
|---|---|---|
|
A cube defined by minimum (x, y, z) and the maximum (x, y, z) |
A 6-tuple (min_x, min_y, min_z, max_x, max_y, max_z) |
The following example shows how to create a green cube of size (1, 1, 1) at position (0, 0, 0).
cube_marker = rviz_marker_publisher.create_cube_marker_from_bbox(name='cube', id=1, bbox3d=[-0.5, 0.5, -0.5, 0.5, -0.5, 0.5], rgba=[0.5, 1.0, 0.5, 0.5])
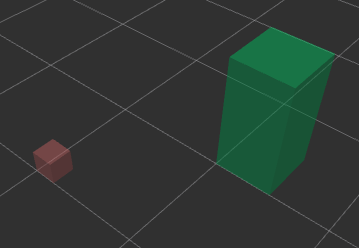
The second way is to specify the positions and the orientation of the cube through the parameter xyzrpy, and the size through the paramterscale.
# the function prototype
def create_cube_marker_from_xyzrpy(name:str, id:int, xyzrpy:list, frame_id:str=None, scale:list=0.5, rgba:list=None, lifetime:float=None) -> Marker
Function parameters |
Definitions |
Acceptable Values |
|---|---|---|
|
The position and optionally the orientation of the cuboid |
A 3-tuple (x, y, z) with (r, p, y) default to (0, 0, 0) |
A 6-tuple (x, y, z, r, p, y) |
||
A |
||
A |
||
|
The size of the cuboid |
A 3-tuple (x, y, z) indicating the lengths along (x, y, z) axes |
A single value for the same length along (x, y, z) axes |
The following example shows how to create a blue cuboid of size (0.5, 1.0, 1.5) at position (2.0, 2.0, 0.5) and orientation (1.2, 0.0, 1.2).
cuboid_marker = rviz_marker_publisher.create_cube_marker_from_xyzrpy(name='cube', id=2, xyzrpy=[2.0, 2.0, 0.5, 1.2, 0.0, 1.2], scale=(0.5, 1.0, 1.5), rgba=[0.0, 0.5, 1.0, 0.5])
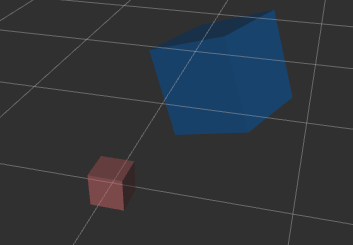
Run the example scripts cube_marker_1.py and cube_marker_2.py for a demonstration.
Text: create_text_marker
A text marker is always screen-facing. Its orientation configuration is largely irrelevant.
# the function prototype
def create_text_marker(name:str, id:int, text:str, xyzrpy:list, frame_id:str=None, scale:list=0.5, rgba:list=None, lifetime:float=None) -> Marker
Function parameters |
Definitions |
Acceptable Values |
|---|---|---|
|
(x, y, z) is the position of the text and the orientation is largely irrelevant |
A 3-tuple (x, y, z) with (r, p, y) default to (0, 0, 0) |
A 6-tuple (x, y, z, r, p, y) |
||
A |
||
A |
||
|
The height of the text |
A single |
The following example shows how to create two red text markers, Hello and World, at position (0, 0, 0) and (1, 0, 0) and sizes 1.0 meters and 2.0 meters respectively.
    text_marker_1 = rviz_marker_publisher.create_text_marker(name='text', id=1, text='Hello', xyzrpy=[0, 0, 0, 0, 0, 0], frame_id='map', scale=1.0)

    text_marker_2 = rviz_marker_publisher.create_text_marker(name='text', id=2, text='World', xyzrpy=[1.0, 0, 0], frame_id='map', scale=2.0)
Run the example script text_marker.py for a demonstration.
Line, Arrow, and Path
Line: create_line_marker
A line marker is defined by two end positions.
# the function prototype
def create_line_marker(name:str, id:int, xyz1:list, xyz2:list, frame_id:str=None, line_width:float=0.01, rgba:list=None, lifetime:float=None) -> Marker
Function parameters |
Definitions |
Acceptable Values |
|---|---|---|
|
(x, y, z) is the position of one end of the line |
A 3-tuple (x, y, z) |
|
(x, y, z) is the position of the other end of the line |
A 3-tuple (x, y, z) |
|
the width of the line |
A single |
The following example shows how to create a 0.05 wide orange line between (-2.5, 0, 0) and (-2.5, 1, 0) which will be deleted after 5.0 seconds of display.
line_marker = rviz_marker_publisher.create_line_marker(name='line', id=i, xyz1=[-2.5, 0, 0], xyz2=[-2.5, 1, 0], frame_id='map', line_width=0.05, rgba=[1.0, 1.0, 0.0, 1.0], lifetime=5.0)
Arrow: create_arrow_marker
An arrow may be defined by the pivot position and orientation. The following function creates an arrow marked from a xyzrpy list.
# the function prototype
def create_arrow_marker_from_xyzrpy(name:str, id:int, xyzrpy:list, frame_id:str=None, arrow_length:float=0.5, arrow_shaft_diameter:float=0.1, arrow_head_diameter:float=0.1, rgba:list=None, lifetime:float=None) -> Marker
Function parameters |
Definitions |
Acceptable Values |
|---|---|---|
|
The position and orientation of the arrow at its pivot |
A 3-tuple (x, y, z) with (r, p, y) default to (0, 0, 0) |
A 6-tuple (x, y, z, r, p, y) |
||
A |
||
A |
||
|
The length of the array |
A single |
|
The diameter of the arrow shaft |
A single |
|
The diameter of the arrow head |
A single |
An arrow marker may also defined by the two end positions, in a way similar to a line marker
# the function prototype
def create_arrow_marker(name:str, id:int, xyz1:list, xyz2:list, frame_id:str=None, arrow_head_length:float=0.05, arrow_shaft_diameter:float=0.1, arrow_head_diameter:float=0.1, rgba:list=None, lifetime:float=None) -> Marker
Function parameters |
Definitions |
Acceptable Values |
|---|---|---|
|
(x, y, z) is the position of one end of the arrow |
A 3-tuple (x, y, z) |
|
(x, y, z) is the position of the other end of the larrowine |
A 3-tuple (x, y, z) |
|
The length of the arrow head |
A single |
|
The diameter of the arrow shaft |
A single |
|
The diameter of the arrow head |
A single |
Path: create_path_marker
A path is defined by a list of sequential positions connected as a continuous line.
# the function prototype
def create_path_marker(name:str, id:int, xyzlist:list, frame_id:str=None, line_width:float=0.01, rgba:list=None, lifetime:float=None) -> Marker
Function parameters |
Definitions |
Acceptable Values |
|---|---|---|
|
The list of positions that defines the path of continuous lines |
A list of 3-tuples (x, y, z) |
|
The width of the line |
A single |
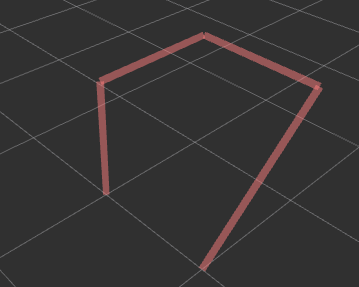
The following example shows how to define a path that connects the points defined for the parameter xyzlist: (0, 0, 0), (0, 0, 1), (0, 1, 1), (1, 1, 1), and (1, 0, 0)
path_marker = rviz_marker_publisher.create_path_marker(name='path', id=1, xyzlist=[(0, 0, 0), (0, 0, 1), (0, 1, 1), (1, 1, 1), (1, 0, 0)], frame_id='map',
                                                line_width=0.05, rgba=[1.0, 0.5, 0.5, 0.5])
Run the example scripts arrow_marker.py, line_marker_multi.py and path_marker.py for a demonstration.
Mesh: create_mesh_marker
The function is used to create a mesh marker from a resource URI, such as a file in STL or DAE format. The actual acceptable formats depends on the visualization tool.
# the function prototype
def create_mesh_marker(name:str, id:int, resource_uri:str, xyzrpy:list, frame_id:str, scale:list=0.5, rgba:list=None, lifetime:float=None) -> Marker
Function parameters |
Definitions |
Acceptable Values |
|---|---|---|
|
The URI to the 3D asset |
URI schemes include |
|
The position and orientation of the mesh |
A 3-tuple (x, y, z) with (r, p, y) default to (0, 0, 0) |
A 6-tuple (x, y, z, r, p, y) |
||
A |
||
A |
The following example shows how to create a mesh marker from the resource at package://rviz_marker_publisher/examples/assets/utah_teapot.stl, and position the mesh at (-1.0, -1.0, 0.0) with orientation (0, 0, 0) with respect to the fixed frame (map), and the size is 0.05 meters along all three axes.
teapot_mesh = 'package://rviz_marker_publisher/examples/assets/utah_teapot.stl'

mesh_marker = rviz_marker_publisher.create_mesh_marker(name='teapot', id=1, resource_uri=teapot_mesh, xyzrpy=[-1.0, -1.0, 0.0, 0, 0, 0],
                                    frame_id='map', scale=[0.05, 0.05, 0.05], rgba=[0.5, 1.0, 1.0, 1.0])
Refer to setup.py for how to specify data paths and their target folders for the package installation.
Run the example script mesh_marker.py for a demonstration.
AxisPlane: create_axisplane_marker
An axisplane is a reference plane aligned with one of the three orientations (XY, XZ, and YZ) and it is useful for visualization of alignment of sensors, scene objects, and tranforms.
# the function prototype
def create_axisplane_marker(name:str, id:int, bbox2d:list, offset:float, frame_id:str, axes:str='xy', plane_thickness=0.005,
                             rgba:list=None, lifetime:float=None)-> Marker
Function parameters |
Definitions |
Acceptable Values |
|---|---|---|
|
The minimum and maximum corners |
A 4-tuple (min_x, min_y, max_x, and max_y) for the |
|
The offset distance from the plane where z = 0 for the |
A single |
|
The axes that define the plane |
A string |
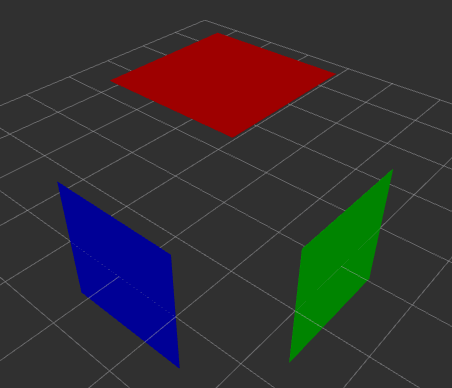
The following example shows how to create a reference frame for each of the xy, xz, or yz combinations. For the xy reference plane, the offset is the position where the plane is located on the z axis.
    axis_plane_marker_xy = rviz_marker_publisher.create_axisplane_marker(name='axisplane', id=1, bbox2d=[-1, -1, 1, 1], offset=2,
                                                               frame_id='map', axes='xy', rgba=[1, 0, 0])
    rv.publish_and_cache(axis_plane_marker_xy)
    # add a axis plane marker on xy plane as a marker to the RVizVisualizer
    axis_plane_marker_xz = rviz_marker_publisher.create_axisplane_marker(name='axisplane', id=2, bbox2d=[-1, -1, 1, 1], offset=2,
                                                               frame_id='map', axes='xz', rgba=[0, 1, 0])
    rv.publish_and_cache(axis_plane_marker_xz)
    # add a axis plane marker on yz plane as a marker to the RVizVisualizer
    axis_plane_marker_xz = rviz_marker_publisher.create_axisplane_marker(name='axisplane', id=3, bbox2d=[-1, -1, 1, 1], offset=2,
                                                               frame_id='map', axes='yz', rgba=[0, 0, 1])
    rv.publish_and_cache(axis_plane_marker_xz)
Run the example scripts axisplane_marker.py for a demonstration.
Building MarkerArray
The package provides one function for creating a MarkerArray, by converting a list of Marker messages into a MarkerArray message.
# the function prototype
def create_marker_array(markers_list:list[Marker]) -> MarkerArray
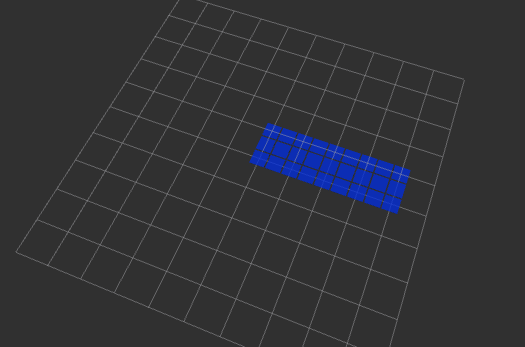
The following example shows the use of a loop to create a grid of 3x3 tiles (cube markers) and append them to a list, and then call the above function to create a MarkerArray.
markers_list:list[Marker] = []
grid_cell_size = [0.5, 0.5]
for x in range(3):
    for y in range(3):
        xyzrpy=[x * grid_cell_size[0], y * grid_cell_size[1], 0.0, 0, 0, 0]
        tile = rviz_marker_publisher.create_cube_marker_from_xyzrpy('tile', x + y * 3, xyzrpy, frame_id='map',
                                scale=[0.3, 0.3, 0.3], rgba=[0.0, 0.2, 1.0, 0.5],
                                lifetime=5.0)
        # append the cube marker (the tile) to the list
        markers_list.append(tile)
# convert the list of markers into a marker array
marker_array = rviz_marker_publisher.create_marker_array(markers_list)
Run the example scripts marker_array.py for a demonstration.
Building PointCloud2
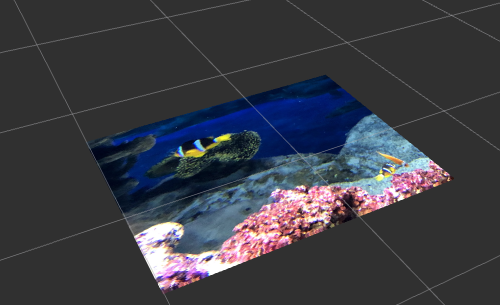
The package provides a function for creating a PointCloud2 from an image.
# the function prototype
def create_pointcloud_from_image(image_bgr:np.ndarray, xyz:list=(0, 0, 0), pixel_physical_size:float=0.005, frame_id:str=None, opacity:float=1.0, depth_array:np.ndarray=None) -> PointCloud2
Function parameters |
Definitions |
Acceptable Values |
|---|---|---|
|
A numpy image of the BGR foramt |
|
|
(x, y, z) is the position of the top left hand corner of the image |
A 3-list (x, y, z) |
|
The size of one pixel |
A |
|
The opacity of the resulting pointcloud |
A |
|
Optionally indicating the depth at each pixel, defaults to None |
A numpy ndarray of exact the same shape as the image |
The following example shows how to create a PointCloud2 message from a numpy image. The get_package_share_directory is a function in the ament_index_python package that returns the installed resource share folder of the package. The top-left corner of the image is mapped to (0, 0.5, 0) and the phyiscal size of pixel is 0.002 in the x and y direction and -1 in the z direction. The z direction setting controls the face-up side of the image.
image_file = os.path.join(get_package_share_directory('rviz_marker_publisher'), 'examples/assets/CoralFish.png')
image_bgr = cv2.imread(image_file)
image_pointcloud2:PointCloud2 = rviz_marker_publisher.create_pointcloud_from_image(image_bgr, (0, 0.5, 0), pixel_physical_size=[0.002, 0.002, -1], frame_id='map')
Run the example scripts pointcloud_from_image.py for a demonstration.
Deleting Marker, MarkerArray, and PointClouds
The RvizMarkerPublisher instance provides the following functions for deletion of objects (markers, markerarrays, and pointclouds) published earlier.
Type |
Selector |
Function |
Remarks |
|---|---|---|---|
A Specific Marker |
Namespace, ID |
|
Allow only the deletion of a |
A Specific Object |
The Object |
|
May delete any of the |
Cached Objects |
Topic |
|
Delete the cached objects that are associated with one of the given topics, default to all the default topics |
All Objects |
Topic |
|
Delete all published and cached objects that are associated with one of the given topics, default to all the default topics |
# the function prototypes
def delete_marker_by_id(self, name:str, id:int) -> None:
def delete_object(self, the_object:Marker | MarkerArray | PointCloud2):
def delete_cached_objects_by_topics(self, topics_list:list=None)
def delete_all_objects_by_topics(self, topics_list:list[str]=None)
Function parameters |
Definitions |
Acceptable Values |
|---|---|---|
|
The name and id of the target marker |
|
|
The object to be deleted |
A |
|
The objects published to the topics in the list are to be deleted |
Default to the default topics defined in |
The following example shows how to delete all objects that have been published and cached to the default topics.
    rv = RvizMarkerPublisher(the_node)
    ...
    rv.delete_all_objects_by_topics()
The following example shows how to delete all MarkerArray objects that have been published and cached to the topic /visualization_marker_array.
    rv = RvizMarkerPublisher(the_node)
    ...
    rv.delete_all_objects_by_topics(['/visualization_marker_array'])
The following example shows how to delete all the cached Marker published to the topic /rviz_marker.
    rv = RvizMarkerPublisher(the_node)
    ...
    rv.delete_cached_objects_by_topics(['/rviz_marker'])
The following example shows how to delete a marker by its name and id. Note that there is no feedback if the marker does not exist.
    rv = RvizMarkerPublisher(the_node)
    ...
    rv.delete_marker_by_id(name='workarea', id=1)
Updating the Pose of Markers
The RvizMarkerPublisher instance provides the following functions for updating the pose of markers.
Function |
Function |
Remarks |
|---|---|---|
|
Set a new pose in xyzrpy format |
A None value at any index will have the current value as default |
|
Move the marker by an offset in xyz |
A 3-tuple xyz |
# function prototypes
def update_marker_xyzrpy(marker:Marker, xyzrpy:list) -> None:
def move_marker(marker:Marker, xyz_offset:list) -> None:
Function parameters |
Definitions |
Acceptable Values |
|---|---|---|
|
The marker to be updated |
A |
|
The new pose in xyzrpy format |
A 6-tuple (x, y, z, r, p, y) |
|
The displacement from the current position |
A 3-tuple (dx, dy, dz) |
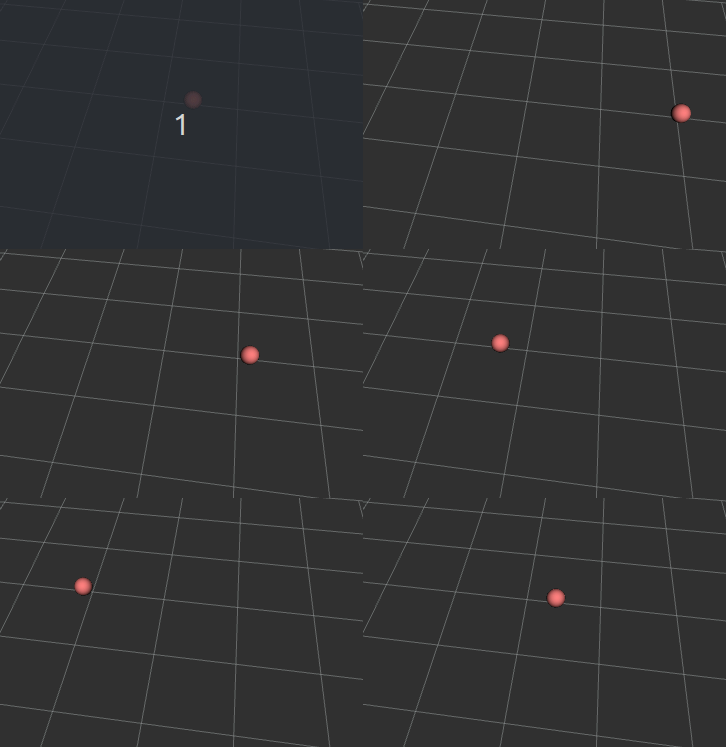
The following example shows the use of the function update_marker_xyzrpy to update the x and y positions of a sphere marker by a random number generator. The other values in the pose (in xyzrpy format) remains unchanged.
    # create a sphere marker at (0, 0, 0) with orientation (0, 0, 0)
    xyzrpy = [0, 0, 0, 0, 0, 0]
    sphere_marker = rviz_marker_publisher.create_sphere_marker(name='sphere', id=1, xyzrpy=xyzrpy, frame_id='map', scale=0.20, rgba=[1.0, 0.5, 0.5, 1.0])
    ...
    for _ in range(100):
        # randomly generate a new x and y values, all other values are unchanged
        xyzrpy = [random.uniform(-0.5, 0.5), random.uniform(-0.5, 0.5), None, None, None, None]
        rviz_marker_publisher.update_marker_xyzrpy(sphere_marker, xyzrpy)
        rv.publish(sphere_marker)
        time.sleep(0.1)
The following example shows the use of the function move_marker to move the sphere marker 0.1 meter per timestep back and forth between x = 0.0 and x = 3.0.
    # create a sphere marker at (0, 0, 0) with orientation (0, 0, 0)
    xyzrpy = [0, 0, 0, 0, 0, 0]
    sphere_marker = rviz_marker_publisher.create_sphere_marker(name='sphere', id=1, xyzrpy=xyzrpy, frame_id='map', scale=0.20, rgba=[1.0, 0.5, 0.5, 1.0])
    ...
    dx = 0.1
    for _ in range(100):
        pose = sphere_marker.pose
        dx = -dx if pose.position.x < 0.0 or pose.position.x > 3.0 else dx
        rviz_marker_publisher.move_marker(sphere_marker, [dx, 0.0, 0.0])
        rv.publish(sphere_marker)
        time.sleep(0.1)
Run the example scripts marker_animation_1.py, marker_animation_2.py and marker_animation_3.py for a demonstration.
Marker-Linked Transforms and Custom Transforms
Marker-Linked Transforms
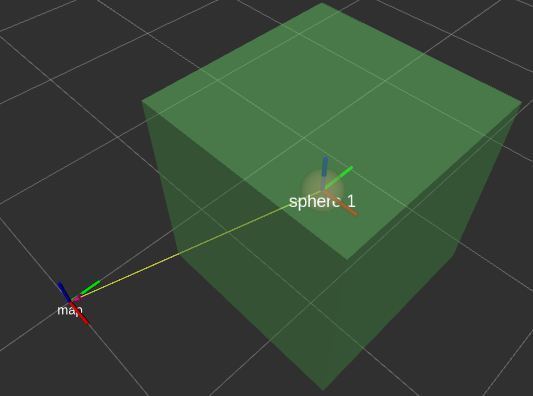
With the package RvizMarkerPublisher, a marker can represent both a visualization object and a reference frame. RvizMarkerPublisher can manage and regularly publish the transform from the parent frame of the marker to its current pose.
To turn a marker into a reference frame, publish the marker using publish_and_cache and set the parameter pub_tf to True. After this, RvizMarkerPublisher will regularly publish the transform until the cached marker is deleted. Note that the pub_tf parameter has no effect on MarkerArray and PointCloud2 types of objects.
The following example shows how to turn a sphere marker into a reference frame. Note that the name of tf is formed from the name and the id of the marker, and in the following example, the frame is called sphere.1.
    sphere_marker = rviz_marker_publisher.create_sphere_marker(name='sphere', id=1, xyzrpy=[1, 1, 1], frame_id='map', scale=0.20, rgba=[1.0, 0.5, 0.5, 0.5])
    rv.publish_and_cache(sphere_marker, pub_tf=True)  # the tf is named 'sphere.1'.
The transform from the parent frame map to the marker’s frame sphere.1 is added to the tree of transforms. The sphere marker can be used as the parent frame of other markers. The following examples shows how to use sphere.1 as the parent frame of a new cube marker.
    cube_marker = rviz_marker_publisher.create_cube_marker_from_bbox(name='cube', id=1, bbox3d=[-0.5, 0.5, -0.5, 0.5, -0.5, 0.5], frame_id='sphere.1', rgba=[0.5, 1.0, 0.5, 0.5])
    rv.publish_and_cache(cube_marker)
The transform is linked to the pose of the marker. The transform is updated when the pose of the marker is updated. The following example shows shifting the sphere marker by (-1.0, -1.0, 0.0) updates the cube marker by the same displacement at the same time.
    rviz_marker_publisher.move_marker(sphere_marker, (-1.0, -1.0, 0.0))
    # the cube marker pose is also updated by the offset (-1.0, -1.0, 0.0)
Run the example scripts marker_pub_tf.py for a demonstration.
Custom Transforms
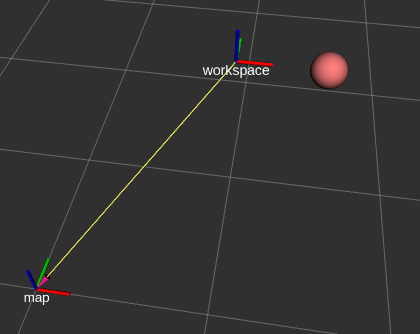
RvizMarkerPublisher supports defining custom transforms that are independent of marker-linked tranforms.
# function prototype
def publish_custom_tf(self, frame_id:str, parent_frame_id:str, pose:Pose, static_tf:bool=False, linked_marker:Marker=None) -> None:
Function parameters |
Definitions |
Acceptable Values |
|---|---|---|
|
The new frame of the transform |
|
|
An existing frame as the parent of the transform |
|
|
The pose of the new frame |
The pose is ignored if linked_marker is given |
Accepts pose formats similar to other functions in the package |
||
|
Publish this transform as static (latched) |
|
|
Define a marker-linked transform if a marker is provided |
|
The following example shows how to define a new frame called workspace from the parent frame map.
    # add a custom frame called 'workspace' from the parent frame 'map'
    transform_pose = Pose()
    transform_pose.position = Point(x=1.0, y=1.0, z=1.0)
    transform_pose.orientation = Quaternion(x=0.0, y=0.0, z=0.0, q=1.0)
    logger.info(f'(define custom tf) publish_custom_tf "workspace" at {transform_pose}')
    rv.publish_custom_tf('workspace', 'map', transform_pose)
Run the example scripts custom_transform.py for a demonstration.
Activate New Topics
To create topics in addition to the default topics, use the function activate_topic.
def activate_topic(self, topic:str, message_cls:type, qos_profile:QoSProfile=None) -> None
Function parameters |
Definitions |
Acceptable Values |
|---|---|---|
|
The new topic name |
|
|
The target message class |
One of |
|
The Qos Profile for the topic |
|
The ValueError will be raised if the topic is already used.
The topic may be removed using the function deactivate_topic
def deactivate_topic(self, topic:str) -> None
Run the example scripts topic_activate.py for a demonstration.
Configure the RvizMarkerPublisher Instance
Some critical characteristics of publishing objects/markers by RvizMarkerPublisher can be configured through passing parameters to the constructor during instantiation. The following table lists the
parameters.
Constructor parameters |
Type |
Optional |
Remarks |
|---|---|---|---|
|
|
Mandatory |
|
|
|
Optional |
The fixed frame to serve as the root of the transforms, default to |
|
|
Optional |
The profile of the default topics, default to a profile of |
|
|
Optional |
The default topic for markers, default to |
|
|
Optional |
The default topic for marker array, default to |
|
|
Optional |
The default topic for pointclouds, default to |
|
Hz, a positive number |
Optional |
The rate refresh publish of cached objects, default to 0.1 Hz |
|
Hz, a positive number |
Optional |
The rate of best effort publish, default to 100 Hz |
|
Hz, a positive number |
Optional |
The rate of transform broadcast, default to 20 Hz |
|
|
Optional |
True if the cached objects are refreshed once in a refresh cycle, default to |
Refresh Cached Objects
The purpose of auto-refresh of cached objects is to publish the objects again regularly, and this is enabled if the auto_refresh parameter is True. The publish of cached object can be manually triggered by calling
the function publish_cached_objects_now if auto refresh is disabled.
# function prototype
def publish_cached_objects_now(self) -> None
Auto-refresh of cached objects is handy for pose update and animation of a set of objects. However, the rate of update is constant and fixed at the instantiation time of RvizMarkerPublisher. If a quick update for an object is required, call publish explicitly for publishing it at the best effort rate.
The Timer Cycle
The RvizMarkerPublisher organizes to-be-published objects into three queues:
The best effort queue: the objects are to be published as soon as the
delayhas elapsed. The objects are removed after they are published.The cached queue: the objects are cached and to be published regularly in cycles for the visualization tools to refresh the scene.
The transforms queue: the transforms are to be broadcast regularly.
The parameters best_effort_timer_rate, refresh_timer_rate, and tf_refresh_timer_rate determinates the intervals between processing each of the three queues.
The Default Topics and QoSProfile
Specify new topic names through the parameters default_marker_topic, default_marker_array_topic and default_pointcloud_topic if it is desirable for the application. The QoSProfile can be specified using the parameter default_qos_profile.
The following example shows how to instantiate a RvizMarkerPublisher with custom default topic names.
rv = RvizMarkerPublisher(the_node, default_marker_topic='rviz_marker', default_pointcloud_topic='rviz_cloud')
Run the example scripts topic_set_default.py for a demonstration.
Configure the rviz_marker_publisher Package
Set Logging Level
To change the logging level of the package, add the following at the start of a script.
import logging
import rviz_marker_publisher
# set the rviz_marker_publisher logging level
rviz_marker_publisher.get_logger().setLevel(logging.WARNING)
The following example will suppress all logging messages from the package.
# supress the rviz_marker_publisher logging
rviz_marker_publisher.get_logger().setLevel(logging.CRITICAL)